Appraisers underutilize time adjustments for local house price growth, even though they can have an important effect on valuations. When made, the adjustments are typically smaller than house price indexes would suggest.
Introduction
Home purchases can be complicated by an appraisal that comes in below the buyer’s contract price offer. For the sale to go through, the buyer typically must renegotiate the purchase price, put more cash down, or accept costlier loan terms. From 2013–2020, the annual rate of appraisals below the contract price ranged from 7 to 9 percent of transactions. Underappraisal spiked to 15 percent in 2021 and 12 percent in 2022, when house prices grew rapidly. Both house price growth and underappraisal rates returned to more typical levels in early 2023.1 Much of this variation occurs because appraisers base valuations on recent sales of comparable properties, which can become outdated quickly during periods of rapid price changes. Low appraisals can also impact refinance borrowers by leading to less attractive loan terms, limiting borrowing amounts, or resulting in canceled transactions.
In principle, appraisers can consider price changes that have occurred since the time the comparables sold and make adjustments known as market conditions adjustments or time adjustments. Fannie Mae, Freddie Mac, and Federal Housing Administration appraisal guidelines require such adjustments whenever market conditions have been changing. However, this blog shows that appraisers frequently do not make time adjustments, even when they are likely to impact the appraised value substantially. This analysis also finds that the adjustments appraisers do make are typically substantially smaller than house price indexes would suggest.
National Trends in Time Adjustment
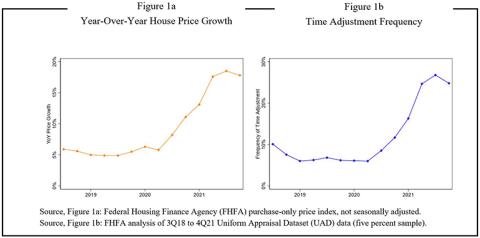
During the analysis period, the third quarter of 2018 through the fourth quarter of 2021, house prices generally rose, especially in 2021.2 Figure 1a shows that national house prices grew annually from 5 to 18 percent over this period. For residential real estate, recent sales of comparable properties are commonly used to determine a property’s valuation. Because comparable sales in this analysis are typically six months old at the time of the appraisal, expected time adjustments would range from approximately 2.5 to 9 percent of the sales price, on average. However, Figure 1b shows that time adjustments are not very common. During much of the analysis period, appraisers time adjusted fewer than 10 percent of comparable sales. Even during the rapid price increases of 2021, time adjustment frequency rose only to about 25 percent. While adjustments are not necessarily expected in every case, these rates seem to be considerably lower than local price growth would warrant, as discussed in the next section.
Do Appraisers Make Time Adjustments When Necessary?
When comparable sales are recent or house price growth is slow or flat, there may be no need for a time adjustment. Thus, to determine whether time adjustments are underutilized, it is insufficient to note that adjustment rates are well below 100 percent. We need a benchmark that estimates how large the adjustment for each comparable should be. Here, monthly house price indexes for ZIP codes are used to walk forward the comparable sales amounts. For each comparable in the data, the price indexes are used to calculate a predicted time adjustment corresponding to the age of the comparable and local price trends.
The table shows that for 20 percent of comparables, the predicted adjustment was less than 1 percentage point in absolute value. For another 16 percent of comparables, the predicted adjustment was between 1 and 2 percentage points. Appraisers time adjusted only about 5 percent of these properties, perhaps because these adjustments are too small to have much impact. However, making no time adjustment amounts to an assumed adjustment of zero, which is unlikely to be accurate. In addition, a leading appraisal textbook discusses several examples featuring time adjustments close to 1 percent, or even less.3 Thus, it appears that adjustments were unnecessary for, at most, the 36 percent of properties where the predicted adjustment was between -1 and 2 percent. This result implies that appraisers should have time adjusted 64 percent of comparables, far greater than the 13 percent they actually adjusted.
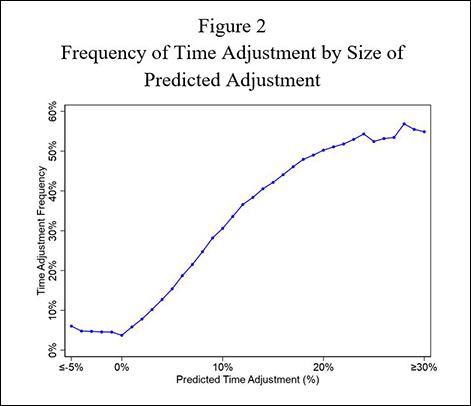
Figure 2 plots the frequency of time adjustment for each percentage point of predicted adjustment.4 Appraisers time adjust most of the time only when the predicted adjustment is 20 percent or larger.
| Time Adjustment Frequency (in percent), by Predicted Adjustment |
||
|---|---|---|
| Predicted Adjustmenta(PA) |
Frequency of Adjustment |
Comparables (column %) |
| Total | 12.6 | 100.0 |
| PA less than -1 | 4.7 | 2.3 |
| -1 ≤ PA < 1 | 3.7 | 20.2 |
| 1 ≤ PA < 2 | 5.8 | 15.8 |
| 2 ≤ PA < 3 | 7.8 | 13.3 |
| 3 ≤ PA < 4 | 10.2 | 10.6 |
| 4 ≤ PA < 5 | 12.7 | 8.3 |
| 5 ≤ PA < 10 | 20.1 | 20.6 |
| PA 10 or more | 38.7 | 9.0 |
| Source: Federal Housing Finance Agency (FHFA) analysis of 3Q18 to 4Q21 Uniform Appraisal Dataset (UAD) data (five percent sample). a. Predictions based on Zillow monthly ZIP5 price index |
||
Are Time Adjustments Accurate?
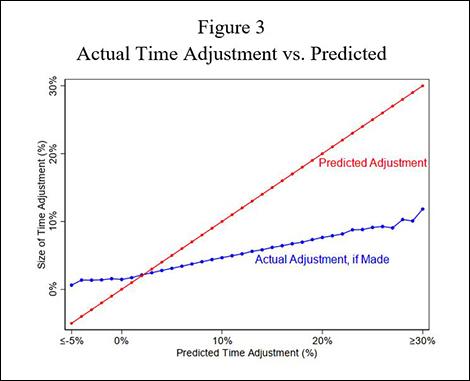
Figure 3 compares the predicted adjustment to the size of the actual adjustment. For predicted adjustments from 1 to 3 percent, actual time adjustments are within a few tenths of a percentage point. However, as the expected adjustment gets larger, the discrepancy grows. When the predicted adjustment is 5 percent, actual adjustments average 3 percent. At 10 percent, actual adjustments average 5 percent.
Conclusion
This blog documents that appraisers underutilize and underestimate time adjustments, but does not attempt to determine the cause or propose potential solutions. One potential reason for underutilization is that these adjustments are some of the more analytically complex calculations appraisers might perform. Also, market information about comparable sales data can be sparse, decentralized, and observed with a lag. The data may also be costly (or at least not always free) and is not always available publicly (which may require paying for access to private databases). A future blog will address some of the factors that determine when appraisers choose to time adjust and examine whether they make them equitably across neighborhoods.
Data
The main dataset used in this blog is a 5 percent sample of single-family housing in the Uniform Appraisal Dataset (UAD) that Fannie Mae and Freddie Mac (the Enterprises) collect.5 The time period covered,
the third quarter of 2018 through the fourth quarter of 2021, includes all the UAD data available to FHFA when the analysis began. The data includes appraisals conducted with the standard appraisal form (Fannie Mae Form 1004/Freddie Mac Form 70), which means it does not include condominiums, manufactured housing, housing with two or more units, single-family investment properties, and less-than-full appraisals. This dataset contains all information from the appraisal forms except for photos and attachments. While the Enterprises collect and maintain the UAD, the data is not limited to Enterprise-backed loans. Approximately 62 percent of appraisals in the data are associated with Enterprise-backed loans. The others are associated with loans originated through other channels (mainly Federal Housing Administration-insured and portfolio loans) or denied and withdrawn applications.
The data was geocoded and merged with census tract demographics from the 2019 American Community Survey five-year file, monthly ZIP5 single-family price estimates from Zillow and counts of home purchase loans by census tract from 2019–2021 Home Mortgage Disclosure Act data.
This report focuses on time adjustments, which appraisers enter in the “date of sale/time” line of the standard appraisal form. For yet-unsold comparables that are currently listed, the “date of sale/time” line instead records the expected discount from the offer price. This analysis examines only comparables that have settled and have a final sales price.
1 The figures are the author’s calculations from the UAD. For similar findings, see Mayer, Yan Ling, “Appraisal Gap Normalizes Amid a Cooling Housing Market”, CoreLogic Quick Take, December 7, 2022. https://www.corelogic.com/intelligence/quick-take-appraisal-gap-normalizes-amid-a-cooling-housing-market/
2 This time period has the advantage of covering both a period with typical time adjustment rates and one with elevated rates.
3 The Appraisal of Real Estate: 15th Edition, Chapters 21-22, Appraisal Institute (2020).
4 The percentages are top-coded at 30 percent and bottom-coded at -5 percent.
5 The Fannie Mae web site documents and describes the UAD data: https://singlefamily.fanniemae.com/delivering/uniform-mortgage-data-program/uniform-appraisal-dataset. FHFA’s documentation for its UAD aggregate statistics dataset is also a useful resource. See: FHFA, The Uniform Appraisal Dataset Aggregate Statistics Data File Overview.
Tagged: FHFA Insights Blog; Appraisals; Market Conditions Adjustment; Time Adjustment; Uniform Appraisal Dataset (UAD)
By: Scott Susin
Senior Economist
Office of Fair Lending Oversight
Division of Housing Mission and Goals