FHFA recently published its Uniform Appraisal Data (UAD) Aggregate Statistics Data File and Dashboards. The aggregate statistics in the Data File and Dashboards are derived from more than 47 million appraisals conducted between 2013 and June 30, 2022. This blog highlights how the new statistical tools can provide key insights into potential appraisal bias concerns.
Background
Today, Black and Latino families have considerably less wealth than White families. The 2019 Survey of Consumer Finances finds that White families on average hold $983,400 in wealth, compared to $142,500 for Black and $165,500 for Latino families on average, respectively.[1] For most Americans, the largest driver of wealth is their home. This makes it critically important to have accurate, unbiased home valuations.
Recent research, however, suggests that there are racial and ethnic differences in home valuations. The Brookings Institute showed a robust relationship between lower valuations and Black neighborhoods.[2] FHFA's Chandra Broadnax highlighted examples of overt references to race in appraisals and the importance of appraisals in the discussion of wealth inequality.[3] Freddie Mac's research showed that properties in minority tracts are more likely than properties in White tracts to receive an appraisal lower than the contract price.[4] Fannie Mae's publication concluded that White borrowers' homes were overvalued at higher rates across all neighborhoods, but stronger effects were present for White borrowers in Black neighborhoods.[5]
Undervaluation Metric
Building off this collection of research, the UAD Aggregate Statistics published by FHFA include a statistic that shows the percent of properties that appraise for less than what a buyer has offered to pay—the contract price. In this research blog, we refer to this statistic as undervaluation.[6] UAD Aggregate Statistics, including undervaluation, are available by state and by metro area, and by the racial/ethnic demographic composition of the census tract.[7]
The UAD Aggregate Statistics allow users to calculate the difference in undervaluation proportions for high minority tracts relative to White tracts to find the undervaluation gap. While controlling for observable characteristics may explain some of the gap in undervaluation between White and high minority areas, it is not likely to explain all of the difference.
Undervaluation, from an appraisal perspective, creates additional risk for the buyer and seller in a transaction, as the loan may not be supported by the property as collateral. This may lead to a renegotiated sales price as the buyer or seller would have to make up the difference to offset the risk to the lender. In addition, the loan is more likely not to close, as any one of the parties may walk away from the transaction.
Findings
Figure 1
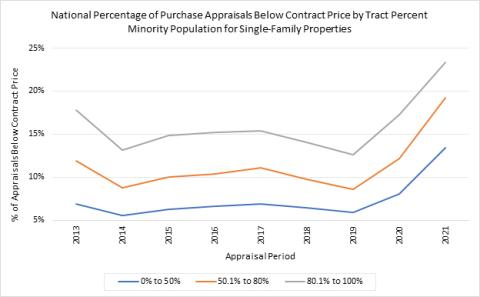
The UAD Aggregate Statistics highlight that properties located in minority tracts have a higher proportion of appraised values less than the contract price, as seen in Figure 1. According to the 2021 appraisal statistics, 23.3% of homes in high minority tracts (80.1-100%) experienced undervaluation. This is compared to 13.4% of homes in White tracts (0-50%) and 19.2% in minority tracts (50.1-80%). Using the proportion as a ratio with White tracts as the control group yields a value of 1.74 for high minority tracts and 1.43 for minority tracts. In other words, the proportion of properties that are undervalued in high minority tracts is 74% greater than the proportion in White tracts. In minority tracts, the comparable proportion of undervaluation is 43% greater than in White tracts.
Some metro areas may experience a higher rate of undervaluation than others based on expected appreciation, property condition, number of homes available for sale, demand from potential buyers, and other observable characteristics. The purpose of tying appraised value to the contract price is that real demand exists at the specified contract price. Data from the UAD Aggregate Statistics indicate that appraisers have a bias to meet or exceed the contract price, as the potential for a failed transaction creates additional risk. In 2021 from a national perspective, 15.2% of appraisals were below the contract price, compared to 26.7% of appraisals equal to the contract price, and 58.1% above the contract price. Neighborhood heterogeneity also plays a role, as more variability in the housing stock and variance in comparable sales creates uncertainty.
Figure 2
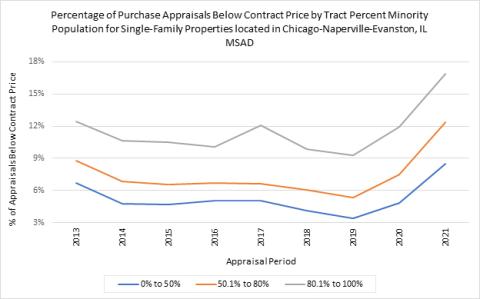
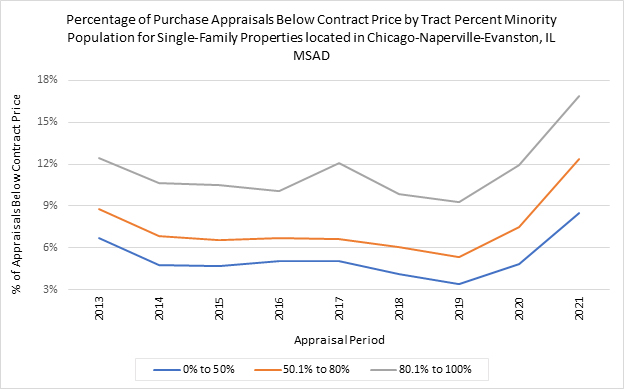
In Chicago, for example, White tracts (0-50%) have an undervaluation rate of 8.5% compared with high minority tracts (80.1-100%) that are undervalued at a rate of 16.9% in recent data collected by FHFA (Figure 2). The ratio of undervaluation in this instance is 1.99.
Figure 3
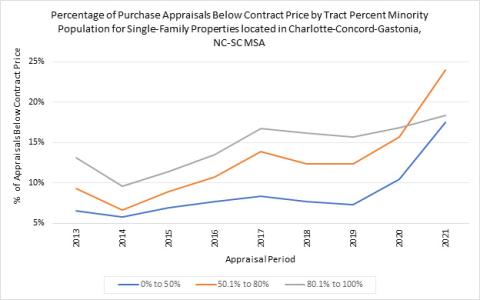
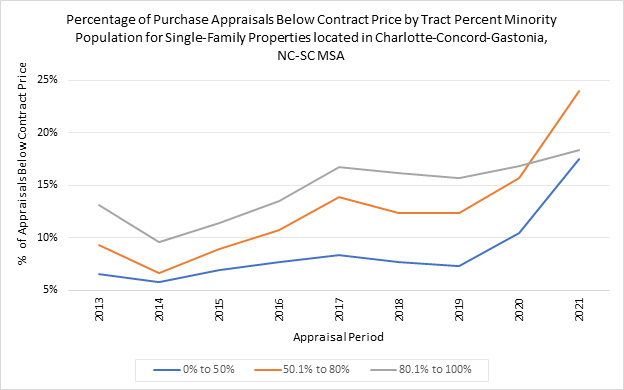
From a practical perspective, compliance departments of lenders and appraisal management companies could use the UAD Aggregate Statistics Dashboards to narrow the scope of an exam or compliance review related to appraisal bias. For example, in 2021 in the Charlotte, North Carolina Metropolitan Statistical Area, reviewers may want to focus on minority tracts (50.1-80%), which have a higher proportion of undervaluation than high minority and White tracts (Figure 3).
Key Takeaways
This research note highlights a few ways that the UAD Aggregate Statistics Dashboards can be used to explore potential appraisal bias—using the “tract percent minority population" property characteristic and the “percent of appraisals below contract price" property statistic. The gap in undervaluation is notable, and the new datasets may be helpful in better understanding the disparities.
[1] See https://www.federalreserve.gov/econres/notes/feds-notes/disparities-in-wealth-by-race-and-ethnicity-in-the-2019-survey-of-consumer-finances-20200928.html.
[2] See https://www.brookings.edu/research/biased-appraisals-and-the-devaluation-of-housing-in-black-neighborhoods/.
[3] See https://www.fhfa.gov/blog/insights/reducing-valuation-bias-by-addressing-appraiser-and-property-valuation-commentary.
[4] See https://www.freddiemac.com/research/insight/20210920-home-appraisals.
[5] See https://www.fanniemae.com/media/42541/display.
[6] Percent of homes with appraisal value less than the contract price is available for home purchase loans only. Identifying overvaluation is an important function of an appraisal, but is not the focus of this blog.
[7] We categorize census tracts based on the percentage of minority population. White tracts include minority population [0-50%], minority tracts are [50.1-80%], and high minority tracts are [80.1-100%].
Tagged: Fair Lending; fair housing; Appraisals; Open Data; Source: FHFA; Data; Data Dashboards; Aggregate Statistics; Uniform Residential Appraisal Report (URAR)
By: Jonathan Liles
Senior Financial Analyst
Division of Housing Mission and Goals
Office of Fair Lending Oversight