The Housing and Economic Recovery Act of 2008 (HERA) imposes several important data requirements on FHFA. Section 1324 requires FHFA to provide to Congress an Annual Housing Report on the performance of Freddie Mac and Fannie Mae (the Enterprises) in the previous year. As an input to FHFA's Annual Report to Congress, HERA requires FHFA to conduct a monthly survey of mortgage markets, collecting data on the characteristics of individual mortgages eligible for acquisition by the Enterprises and of mortgages that are not.[1] The National Mortgage Database (NMDB) was created in part to fulfill this requirement.[2] Selected aggregate data from NMDB from January 2009 through June 2020 is available on the FHFA website at fhfa.gov/nmdbdata.
This blog presents statistics for mortgages acquired and not acquired by the Enterprises, using the NMDB data. FHFA has not provided such statistics before. We present a figure showing the Enterprise share of all mortgage originations over time and three tables showing means and incidence of various mortgage characteristics for different market segments for the last several years, and the distribution of “higher-risk" mortgages across the same market segments and years.
Freddie Mac and Fannie Mae acquire residential mortgages from mortgage lenders and are prevented by statute from acquiring mortgages larger than a preset size defined as the “conforming limit," which changes annually. Figure 1 presents the percentage share of all mortgage originations from 2002 through the second quarter of 2020 that were acquired by the Enterprises.[3] Over this 18-year period, the Enterprise share ranged from a low of 39 percent in 2005 to a high of 64 percent in 2011, averaging 54 percent over the entire period.
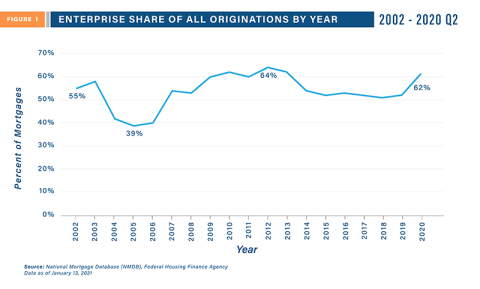
Table 1 presents mortgage share and selected loan characteristics by mortgage market segment for 2018, 2019, and the first 6 months of 2020. The market segments shown are all loans, conforming market, government insured, Enterprise acquired, other conforming and jumbo.[4] Enterprise acquisitions represented 52 percent of all mortgage originations in 2019 and 62 percent of all originations in the first 6 months of 2020. In comparison, government and other conforming mortgages represented 44 percent of all mortgage originations in 2019 and 36 percent of all originations in the first 6 months of 2020.
|
Table 1 Mortgage Share and Selected Loan Characteristics by Origination Year and Market Segment: 2018, 2019 and the First 6 Months of 2020 |
||||||
|---|---|---|---|---|---|---|
|
|
2018 |
2019 |
2020 |
2018 |
2019 |
2020 |
|
|
Percentage Share of All Loans (% Orig.) |
Average Contract Rate (%) |
||||
|
All Loans |
100% |
100% |
100% |
4.8% |
4.2% |
3.5% |
|
Conforming Market |
96% |
96% |
97% |
4.8% |
4.2% |
3.5% |
|
Government Insured |
26% |
27% |
23% |
4.7% |
4.2% |
3.5% |
|
Enterprise Acquired |
51% |
52% |
62% |
4.7% |
4.2% |
3.5% |
|
Other Conforming |
18% |
17% |
13% |
5.0% |
4.5% |
3.9% |
|
Jumbo |
4% |
4% |
3% |
4.6% |
3.9% |
3.5% |
| |
Average Loan Amount ($) |
Average Purch. Price / App. Value ($) |
||||
|
All Loans |
$252,000 |
$279,000 |
$289,000 |
$342,000 |
$381,000 |
$426,000 |
|
Conforming Market |
$222,000 |
$248,000 |
$265,000 |
$297,000 |
$333,000 |
$385,000 |
|
Government Insured |
$223,000 |
$248,000 |
$261,000 |
$242,000 |
$273,000 |
$317,000 |
|
Enterprise Acquired |
$235,000 |
$261,000 |
$280,000 |
$328,000 |
$369,000 |
$420,000 |
|
Other Conforming |
$187,000 |
$206,000 |
$204,000 |
$289,000 |
$317,000 |
$334,000 |
|
Jumbo |
$917,000 |
$962,000 |
$997,000 |
$1,352,000 |
$1,432,000 |
$1,673,000 |
| |
Percent Refinance (% Originations) |
Percent First Time Homebuyer |
||||
|
All Loans |
33% |
46% |
65% |
34% |
29% |
19% |
|
Conforming Market |
33% |
46% |
65% |
34% |
30% |
19% |
|
Government Insured |
25% |
40% |
52% |
50% |
43% |
34% |
|
Enterprise Acquired |
36% |
49% |
72% |
29% |
24% |
14% |
|
Other Conforming |
35% |
45% |
55% |
28% |
26% |
21% |
|
Jumbo |
31% |
50% |
64% |
20% |
14% |
11% |
| |
15-Year FRM Mortgage Share (% Orig.) |
30-Year FRM Mortgage Share (% Orig.) |
||||
|
All Loans |
8% |
9% |
13% |
78% |
78% |
73% |
|
Conforming Market |
8% |
9% |
14% |
79% |
79% |
74% |
|
Government Insured |
2% |
1% |
1% |
95% |
95% |
91% |
|
Enterprise Acquired |
10% |
12% |
17% |
83% |
81% |
73% |
|
Other Conforming |
11% |
12% |
20% |
42% |
46% |
45% |
|
Jumbo |
3% |
4% |
6% |
60% |
59% |
64% |
| |
Average CLTV (% Originations) |
ARM Share (% Originations) |
||||
|
All Loans |
78% |
78% |
74% |
5% |
4% |
2% |
|
Conforming Market |
78% |
78% |
74% |
4% |
2% |
1% |
|
Government Insured |
93% |
92% |
87% |
1% |
0% |
1% |
|
Enterprise Acquired |
76% |
75% |
71% |
1% |
1% |
0% |
|
Other Conforming |
64% |
65% |
62% |
14% |
11% |
4% |
|
Jumbo |
75% |
73% |
69% |
33% |
33% |
26% |
Source: National Mortgage Database, FHFA
What mortgages did the Enterprises acquire relative to other market segments? From 2018 through the second quarter of 2020, the Enterprises were more likely to acquire refinanced mortgages, more likely to acquire 15-year fixed-rate mortgages, less likely to acquire adjustable-rate mortgages, and less likely to acquire loans to first-time homebuyers (who, by definition, are purchasers) than all other segments of the mortgage market.[5] The Enterprise acquisitions were not significantly different in average purchase price and average loan amount from most other market segments, although both averages were slightly larger than the averages for government insured mortgages. There was no appreciable difference in mortgage contract rate across all the segments, however, the rates for jumbo mortgages were consistently higher and the rates for other conforming mortgages were consistently lower than the overall average.
While making residential mortgages, underwriters typically use the following information to assess the risk of mortgage default: 1) the capacity of the borrower to afford the mortgage out of income, 2) the creditworthiness of the borrower, and 3) the mortgage to the property value ratio. The mortgage industry has developed metrics to reflect these measures of risk based on many years of consumer behavior: debt to income (DTI) ratio, credit scores, and combined loan-to-value (CLTV) ratio. [6]
Table 2 presents the distribution of mortgage originations by several metrics representing “higher risk": the percent of loans with DTI greater than 43 percent, the percent with credit scores below 660, and the percent with CLTV greater than 90 percent.
|
Table 2 Mortgage Risk Characteristics by Origination Year and Market Segment: 2018, 2019 and the First 6 Months of 2020 |
||||
|---|---|---|---|---|
|
2018 p=""> |
2019 p=""> |
2020 |
||
|
|
Share with DTI Greater Than 43% |
|||
|
All Loans |
31% |
28% |
24% |
|
|
Conforming Market |
32% |
29% |
24% |
|
|
Government Insured |
48% |
47% |
42% |
|
|
Enterprise Acquired |
29% |
23% |
18% |
|
|
Other Conforming |
18% |
16% |
18% |
|
|
Jumbo |
20% |
19% |
32% |
|
|
|
Share with Credit Scores Below 660 |
|||
|
All Loans |
19% |
17% |
14% |
|
|
Conforming Market |
20% |
18% |
14% |
|
|
Government Insured |
39% |
39% |
36% |
|
|
Enterprise Acquired |
9% |
7% |
6% |
|
|
Other Conforming |
20% |
20% |
17% |
|
|
Jumbo |
4% |
4% |
3% |
|
|
|
Share with CLTV Greater than 90% |
|||
|
All Loans |
35% |
32% |
23% |
|
|
Conforming Market |
36% |
33% |
23% |
|
|
Government Insured |
77% |
72% |
60% |
|
|
Enterprise Acquired |
22% |
20% |
12% |
|
|
Other Conforming |
15% |
14% |
8% |
|
|
Jumbo |
9% |
7% |
6% |
|
Source: National Mortgage Database, FHFA
The Enterprises consistently acquired a smaller share of loans with high-risk characteristics than did other market segments. For example, in 2019, 28 percent of all loans had a DTI greater than 43 percent compared to only 23 percent of Enterprises acquisitions. In contrast, almost half the share of government insured loans had a DTI greater than 43 percent. Loans with credit scores less than 660 represented nearly one in six mortgages originated; Enterprises acquisitions were less than half that at one in fourteen mortgages. Loans with a CLTV of greater than 90 percent made up nearly a third of all mortgages originated, while only 20 percent of Enterprise loans had a CLTV greater than 90 percent.
Table 3 provides a comparison by home purchase and refinanced mortgages. When comparing home purchases and refinances by risk categories, there was only a small difference in DTI and credit scores, but the difference in CLTV was sharper. Refinanced loans for all mortgage segments had significantly lower share of high CLTV loans than home purchases for 2018, 2019, and the first six months of 2020.
|
Table 3 Mortgage Share and Selected Loan Characteristics by Origination Year and Market Segment: 2018, 2019 and the First 6 Months of 2020 |
||||||
|---|---|---|---|---|---|---|
|
|
Home Purchase |
Refinance |
||||
|
|
2018 |
2019 |
2020 |
2018 |
2019 |
2020 |
|
|
Share with DTI Greater Than 43% |
Share with DTI Greater Than 43% |
||||
|
All Loans |
31% |
30% |
29% |
31% |
27% |
22% |
|
Conforming Market |
32% |
30% |
29% |
32% |
27% |
21% |
|
Government Insured |
47% |
47% |
45% |
48% |
47% |
39% |
|
Enterprise Acquired |
28% |
25% |
22% |
30% |
22% |
17% |
|
Other Conforming |
17% |
16% |
18% |
18% |
17% |
19% |
|
Jumbo |
19% |
19% |
32% |
23% |
20% |
31% |
|
|
Shares with Credit Scores Below 660 |
Shares with Credit Scores Below 660 |
||||
|
All Loans |
18% |
18% |
18% |
21% |
17% |
11% |
|
Conforming Market |
18% |
18% |
19% |
22% |
18% |
12% |
|
Government Insured |
37% |
38% |
38% |
45% |
40% |
34% |
|
Enterprise Acquired |
7% |
6% |
6% |
14% |
8% |
5% |
|
Other Conforming |
19% |
21% |
21% |
21% |
18% |
13% |
|
Jumbo |
3% |
3% |
3% |
6% |
4% |
3% |
|
|
Share with CLTV Greater Than 90% |
Share with CLTV Greater Than 90% |
||||
|
All Loans |
47% |
48% |
48% |
11% |
14% |
9% |
|
Conforming Market |
48% |
49% |
50% |
11% |
14% |
9% |
|
Government Insured |
90% |
90% |
90% |
38% |
45% |
32% |
|
Enterprise Acquired |
33% |
34% |
35% |
4% |
5% |
4% |
|
Other Conforming |
21% |
21% |
16% |
4% |
4% |
3% |
|
Jumbo |
11% |
11% |
11% |
5% |
3% |
4% |
Source: National Mortgage Database, FHFA
Future posts using NMDB will cover topics such as mortgage performance, market composition, and geographical differences. The purpose of these posts is to provide information to the public about the overall mortgage market.
[1] HERA specifies that this data include the house price, the cumulative loan-to-value ratio, the terms of the mortgage, the creditworthiness of the borrower(s), and whether the mortgage was acquired by an enterprise. Additionally, this data was required to include characteristics of individual subprime and nontraditional mortgages that are eligible for acquisition by the enterprises and the characteristics of borrowers under such mortgages, including the creditworthiness of such borrowers, and the determination whether such borrowers would qualify for prime lending.
[2] The National Mortgage Database (NMDB®) is a nationally representative five percent sample of residential mortgages in the United States. Publication of aggregate data from NMDB addresses the statutory requirements of section 1324(c) of the Federal Housing Enterprises Financial Safety and Soundness Act of 1992, as amended by the Housing and Economic Recovery Act of 2008. The statute requires FHFA to make the data available to the public while protecting the privacy of the borrowers.
[3] All shares in this blog are based on number of mortgage originations, not unpaid-principal balance of the mortgages. All statistics are based on origination year. While many mortgages acquired by an Enterprise are acquired in the same year as the origination, year-end originations and seasoned loans may be acquired in a later year.
[4] All Loans less Jumbo equals Conforming Market for this presentation. The Conforming Market is the sum of Enterprise Acquired, Government insured/Guaranteed, and Other Conforming. Other Conforming includes Private Label MBS and Portfolio (non-jumbo). Jumbo loans are not government insured nor acquired by an enterprise where the loan amount at origination exceeds the Enterprise Conforming Loan Limit. The Enterprise Conforming Loan Limit applicable to a loan is dependent on the county at origination adjusted for number of units on the mortgage.
[5] In this blog, a purchase mortgage is defined as a first-time homebuyer mortgage if is the first ever mortgage for any of up to four borrowers in the NMDB data. Usually the first-time homebuyer share is calculated using only purchase mortgages in the denominator. In contrast, this blog calculates the first-time homebuyer share of all mortgages in Table 1 so that the denominator is the same for all parts of the table.
[6] https://www.experian.com/blogs/ask-experian/credit-education/score-basics/what-is-a-good-credit-score
Tagged: FHFA Stats Blog; Mortgage Acquisitions; National Mortgage Database; NMDB